Historical data can be used to guide investors through challenging times while providing them with a greater understanding of the financial market. With this in mind, we explore how ‘taking the long view’ can help investors make sound investments that minimize risk.
But to maximize value from historical data, we first need to understand how historical events affect the financial market.
Does the History of the Financial Market Repeat Itself?
The prevailing opinion is that financial markets can be predicted because they can be correlated back to some type of simplified cause and effect. And with a short enough horizon, that is often true.
Let’s look at stock markets for instance. Rising interest rates tend to be interpreted as a negative for stocks. Higher interest rates typically result in increased costs, which can lead to lower spending, lower corporate earnings, and lower stock prices.
When interest rates are higher, investors are often advised to trade their high-risk stocks for government bonds — which are typically viewed to be a safer investment.
Conversely, when interest rates are low, costs tend to go down, spending increases, companies grow, and the stock market tends to be viewed as an attractive area for investors who are looking for a higher return than what is available from bonds.
The point is, investor sentiment and behavior have a profound impact on financial markets. As everyday investors get excited about an asset, they can cause pricing to outweigh the intrinsic value of that asset. The Dutch tulip bulb market bubble of the 1600s is an early example, where a handful of tulips accrued the same value as a mansion on the Amsterdam waterfront.
More recent examples include the Dot-com bubble, the mid-2000s housing bubble, as well as crypto and non-fungible tokens (NFTs) in the early 2020s. This boom and bust cycle begins with investors losing track of rational expectations, assets becoming overvalued, and eventually a market correction follows. This can result in a significant selloff with huge losses for investors who still hold these assets. In other words, irrational enthusiasm shifts to irrational panic.
Researching historical data and taking a long-term view can help you rise above the current noise and identify how past events revealed themselves. Researching cyclical patterns can be a guide for what to look out for in the future. This mindset can be critical when looking to identify whether a market might be in a long-term trend with a short-term correction, or whether a bubble is building.
With the right perspective, historical data can give you insight into how an asset performs under different conditions, such as when demand is high but supply is low, or vice versa. While past performance is never a guarantee of future behavior, understanding the history can help prepare for future market behavior — this is the essence of technical analysis, which is a research methodology that studies historical prices and trading patterns.
Investing in History: How Technical Analysis Reveals Financial Market Behavior
Financial markets operate as a cycle, with prices moving up or down in a trend. The cyclical nature of the market is why analysts often say: “the financial market repeats itself.” This is why historical data is used to produce technical indicators, such as moving averages and oscillators, technical analysis aims to determine whether or not current activity is a trend, and if so is that trend likely to continue or reverse.
- Price trends — will tell you whether the price of a security is, on the whole, increasing or decreasing.
- Moving averages — provide a bigger picture view by highlighting the average price of a security over time.
- Chart patterns — the study of price performance on a chart in order to identify transitions between rising and falling trends.
- Momentum indicators — compares the current price of a security vs the recent price. This helps identify potential strength or weakness in the rate of price increase or decline.
- Volume indicators — used to help identify activity level as a means of revealing the potential strength or weakness of current price direction.
While technical analysis using historical data can help you prepare for potential behavior in the financial markets, the events that cause market volatility in any defined period of time are often more difficult to foresee. These can range from supply chain crises, pandemics, and international conflict, to the unexpected departure of a CEO. That’s why monitoring current activity can help you better understand the “why” behind market shifts and whether they are a long- or short-term consideration.
Real-time vs. Historical Data
It is human nature to quickly react — or sometimes overreact — to current events. The speed and strength of this reaction can have an enormous impact on security prices. For instance, and looking again at the stock market, imagine if a publicly traded construction company issues a surprise announcement that it has secured a project to build multiple 80,000-seater stadiums. Fundamental analysts and investors will most likely react positively, and the company’s stock price may increase.
Real-time data, including financial news and investor sentiment analysis, influence investors to quickly respond to market changes. But the danger of using real-time data is that some investors get ‘caught up in the moment,’ leading to poor decision-making and knee-jerk reactions.
For a recent example, look at the start of 2020, when stock markets experienced the biggest fall since 2008. The 24-hour news cycle and fears of the time (due to the pandemic and initial uncertainty of what was ahead) presented a negative outlook that caused many investors to flee both the stock and bond markets. In retrospect, this was a costly mistake. By September 2020, the global equities and fixed income returned 29.54% and 3.16% respectively — according to Dimensional data.
The lesson from this is clear: real-time data, social media, and 24-hour news isn’t enough to accurately predict the stock market, or any financial market. For better results, discipline is required to take real-time data and other streams of information and layer that on top of research of long-term cycles, patterns, and trends. This will help you understand market events within a broader historical context. The value of combining multiple research streams aligns with a recent academic study presented at the First International Conference on Sustainable Technologies for Computational Intelligence. This study combined historical data with news and investor sentiment analysis, improving their prediction accuracy up to 89.80%.
Applying Technical and Real-time Analysis to Financial Markets
Historical events, recurring cycles and patterns, and current trends help provide a roadmap for today’s financial markets. So the more research you do, the better prepared you’ll be to understand how and when to account for these factors — and the better positioned you’ll be to try and recognize market behaviors and opportunities.
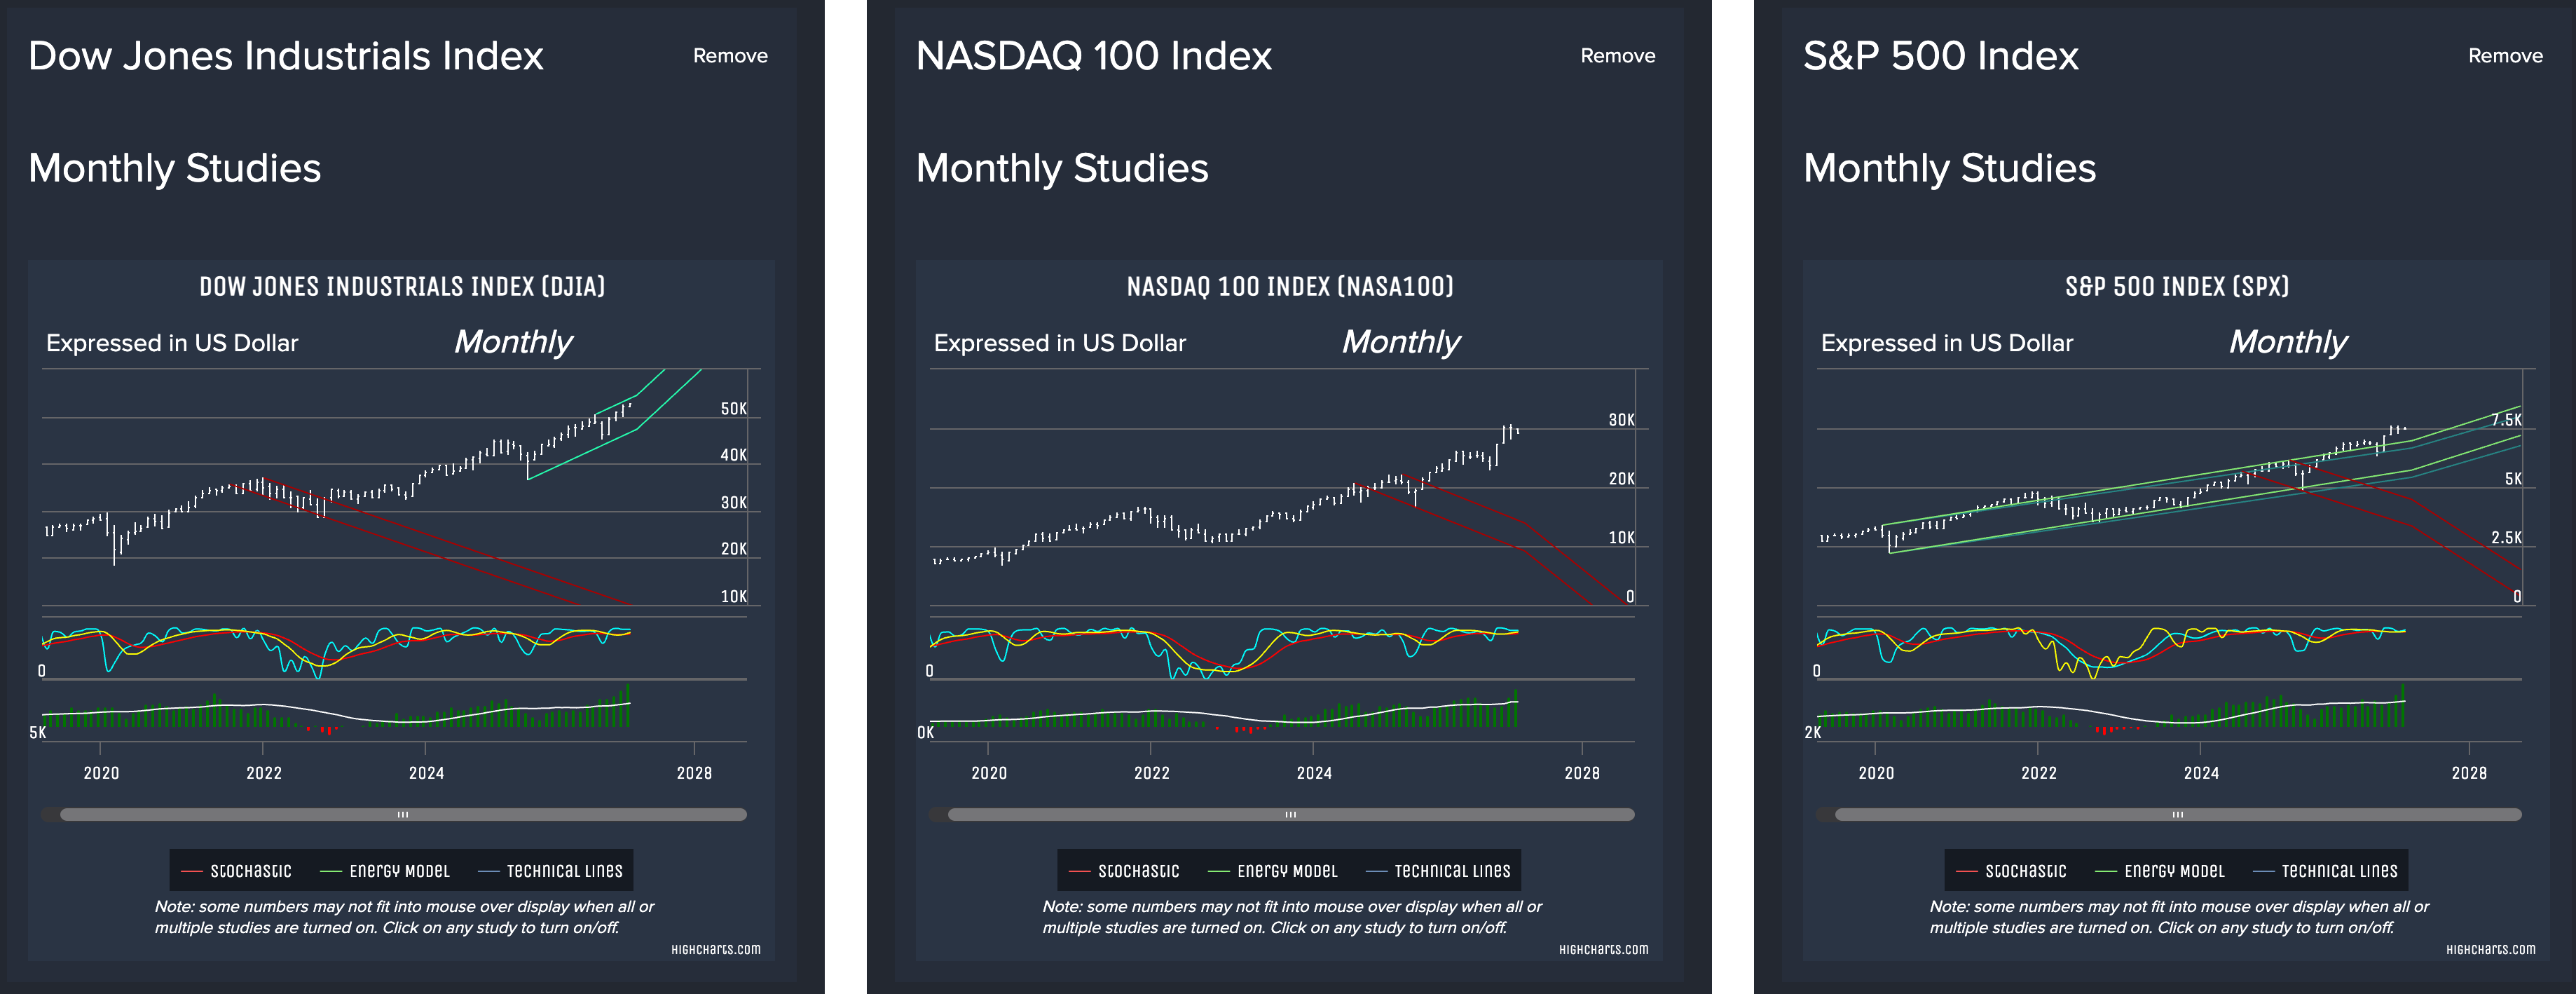
But to recognize opportunity, you need first access to the right set of tools and data. The Socrates Platform is a software-as-a-service system purpose-built to enable you to research financial market history and activity on a global scale. With multiple proprietary computer models, found only on Socrates, users are able to perform their own research on over 1,000+ markets.
Learn more about Socrates and join thousands of other customers researching global financial markets. Sign up today!
Important: Socrates is not a financial service, we do not provide financial advice or recommendations. The platform serves as a research tool for informational and educational purposes only.