Proprietary Models

Energy Models

Measuring Momentum in Financial Markets

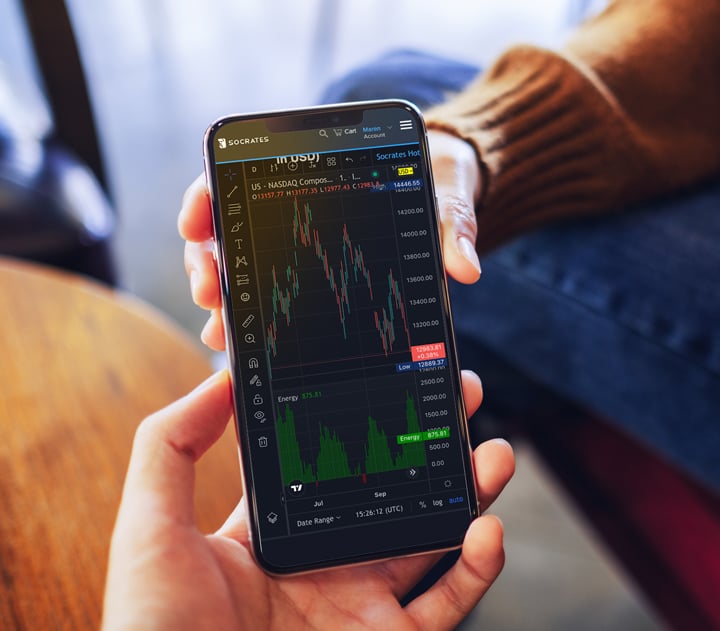
The Energy Model assesses the cumulative rate of change in a market's price movement as a measure of the relative strength or weakness - or "energy" - is behind the current "bullish" (long) side of a market's price activity vs. the "bearish" (short) side.

A simple way to think of it, the Energy Model is a measurement of momentum. The price activity in each market is a reflection of current push-and-pull forces behind it.

When the force behind the "bulls" on long side of a market loses energy, the momentum shifts to the "bears" on the short side.

Energy Model

The Energy Model is an innovative tool that gauges the relative strength or weakness of the bullish (long-side) market price activity, with its ability to enhance the assessment of over-bought and over-sold conditions. The energy Model is a tool for perceiving market momentum.

By quantifying the energy behind market movements, it provides a deeper understanding of momentum dynamics. This unique perspective on bullish and bearish forces offers insights into trend reversals, shifts in sentiment, and potential over-extended conditions.

While the Energy Model opens new doors for understanding market momentum, it's important to note that no tool is infallible. Just like any other indicator, the Energy Model has its limitations and should be part of a comprehensive analysis toolkit.

Importance of Momentum Indicators

 
A common measurement in technical analysis, momentum indicators can offer valuable insights of a market's current trend - especially bullish trends that require more relative strength in a market's price action. This type of analysis may help identify when a market is overextended.
Energy Model Energy Model Energy Model

The Energy Model

Measuring the "energy" (or momentum) behind the buyers (bulls) in a financial market versus the sellers (bears) is a time-tested approach to researching financial market trends. Similar to stochastic studies, the Energy Model can serve as a helpful indicator of when a market may enter over-bought or over-sold conditions.

Understanding the Energy Model Understanding the Energy Model Understanding the Energy Model

Understanding the Energy Model

The market is a never-ending battleground between bulls and bears - a constant tug-of-war shaping price movements. The Energy Model attempts to interpret this. As the bullish side loses its energy, a shift in momentum towards the short side occurs, which can serve as a valuable indicator of possible trend reversals and shifts in market sentiment.

Energy model chart Energy model chart Energy model chart

The Energy Model in Action

The best way to use this tool is alongside a price chart and other technical indicators - including traditional stochastic oscillators. As you study the Energy Model it can be a helpful guide when analyzing a market's trend and looking to identify areas of price support and resistance. The more comprehensive your research is, the more informed your decision-making can be. 

Other Proprietary Models

View Our Membership Plans

The Socrates Platform is designed to give anyone direct access to information that was originally intended for industry professionals. This easy-to-use software-as-a-service solution allows you to research what you want, when you want. With different levels of engagement, the Socrates Platform has a version that works for just about anybody.