Analyzing stock market trends is key to making informed investment decisions and answering questions like: “What stocks should I buy?” and “When should I sell them?”
In this article, we’ll share insights to help investors perform their own stock market analysis. By understanding stock analytics, investors will be in a stronger position to enhance their strategies, identify valuable opportunities, and optimize trade timings.
What is Stock Market Trend Analysis?
Stock market trend analysis involves researching historical price movements and trading volumes to identify patterns that forecast whether a stock is likely to move upward, downward, or remain stable. This knowledge helps investors align their strategies with market movements, improving their chances of making profitable investing decisions.
Researching trends is a form of technical analysis — an investing approach that leverages historical data to understand market behavior. Where technical analysis enables you to analyze broader stock trends, fundamental analysis favors evaluating a basket of internal and external factors, like profit reports and industry conditions.
Both forms of analysis have value and should be considered when assessing stock trends. To learn more about these differing approaches, check out our guide on technical vs. fundamental analysis.
Using Technical Analysis to Research Stock Market Trends
Let's start with the basics. Technical analysts use charts to visualize a stock’s price movements over time and identify trends and patterns. While there are many different chart types, the most common include:
- Line Charts: Show the closing prices over a specific period, offering a clear view of the overall price trend.
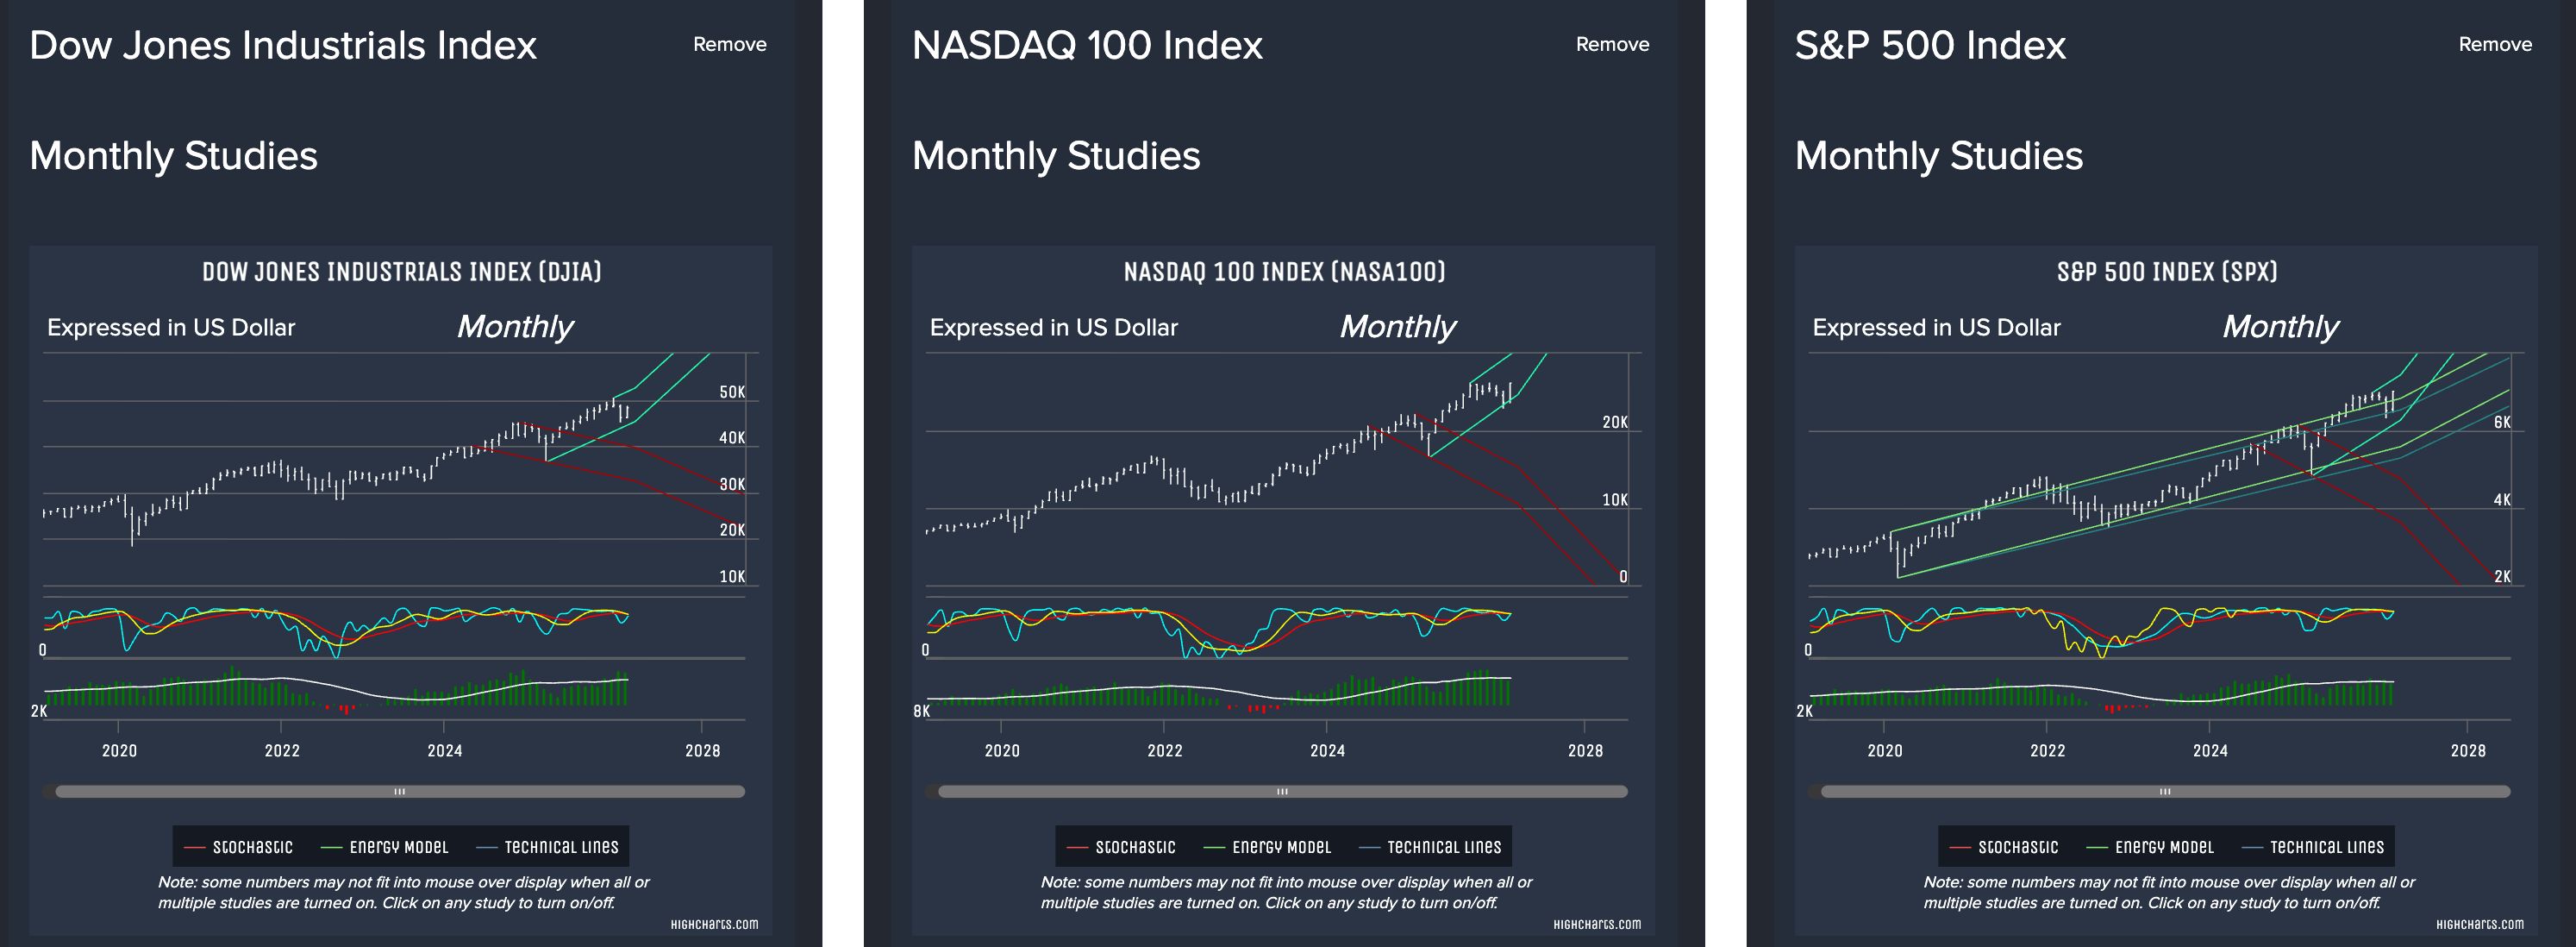
- Open-High-Low-Close (OHLC) / Bar Charts: uses a vertical line to show the range of price movement from the high to the low, and then a small horizontal marker on the left for the open price and another on the right for the close price. This helps visualize price fluctuations for a given trading session or time period. [Note: this is the default charting used by the Socrates Platform].
- Candlestick Charts: Highlight price movements, detailing a period’s opening, closing, high, and low prices.
When studying charts, traders and analysts also rely on "technical indicators" to research stocks. Technical indicators are mathematical calculations applied to stock data to reveal patterns and trends, and generate buy or sell signals. The most common form of technical indicators include:
- Moving Averages (MA): Identify trend movements by averaging out price fluctuations over a period of time. Visually, this converts jagged lines on a chart into smooth and easily understood patterns. The 50-day and 200-day moving average are often referred to when studying daily price movement of a stock.
- Stochastic Oscillators: Compare a stock’s closing price to its price range over a set period. This helps show the stock’s momentum and indicate possible trends and direction changes. Stochastic studies have a value between 0-100, where <20 is considered "oversold" and >80 is considered "overbought". [Note: Stochastic oscillators are included by default on Socrates Platform charts].
- Relative Strength Index (RSI): Used to measure recent price gains versus recent price losses, which makes it valuable in determining trend strength.
Combining chart studies with technical indicators can help identify areas of "technical support" (price levels where a stock has shown to - or is projected to maybe - bounce back up from) or "technical resistance" (price levels where a stock has shown to - or is projected to maybe - turn back down after) in a stock market.
We are talking about stock markets, but the advantage of technical analysis is that the same methods can be applied to analyze other asset classes and financial instruments, including bonds, commodities, currencies / foreign exchange, and ETFs.
How to Analyze a Stock Before Buying It
While many free resources exist online to try and study the stock markets, there are research platform designed to help go a step further. Along with providing access to reliable market data, some platforms have unique features and/or methodologies to help streamline your workflow, enabling you to focus on analysis and decision-making.
With the right platform providing different tools and indicators to research stocks, your analysis should aim to:
- Identify the Trend
Determine whether the market is in an uptrend, downtrend, or sideways trend using trend lines, moving averages, or other charts and indicators. - Analyze Patterns and Indicators
Look for recognizable patterns and use technical indicators to assess the strength and sustainability of the trend. - Confirm Your Hypothesis with Volume Data
While this is typically just a reference data point, many do check trading volume when studying trends and patterns they have identified. High volume is commonly considered a positive sign of momentum behind a trend, while low volume might suggest a lack of momentum or conviction. - Set Entry and Exit Points
No matter how much you study, there is never a "sure thing". Stock markets move up and down for this very reason (if something was obvious a certain, no one would be on the other end of a purchase or sale). So it's important to plan for the worst. Based on your analysis, you can identify areas to consider entering a market, but perhaps even more important is to determine the optimal points to exit a trade. For instance, if a stock is approaching technical support levels on low volume, it might be a good buying opportunity.
How the Socrates Platform Empowers You to Analyze Stock Trends
The Socrates Platform is a powerful, easy-to-use market research tool that enables investors to apply technical analysis to large volumes of historical and current stock data.
Alongside charting and technical indicators, we offer access to unique, proprietary computer models that generate indicators to help identify and analyze momentum, (Energy Model), patterns (Global Market Watch), trends (Indicating Ranges), technical support and resistance price points (Reversal System), and cyclical timing considerations (Timing Arrays) for individual stocks and the broader stock market.
We cover all major stock indices, including most individual stocks relevant to the investing community. To support diverse market research, we also cover commodities, bonds, ETFs, currencies, and leading crypto.
Wondering if the Socrates Platform is right for you?
Learn more about how Socrates can empower your stock market research.
Or explore our membership plans, which are tailored to your research requirements. This ensures you get and use exactly what you pay for and that the platform is as useful to novice investors as experienced professionals.