Volatility is back to start June 2026, right on schedule with Socrates models! But how long will it last?
If you follow the stock market on a frequent basis, the signal-to-noise ratio can get muddy. Nowadays trying to make sense of technical indicators is a challenge when there's so much "noise" thanks to an uncertain geopolitical climate and A.I.-induced FOMO generating hyperbolic analysis (both pro and against).
To demonstrate this, just take a quick note of how some of the major stock indices in the United States closed yesterday (June 10, 2026): S&P 500 (-199.66, -1.62%); Dow Jones Industrial Average (-953.33, -1.87%); NASDAQ Composite Index (-509.32, -1.98%).
In the table below you can see the notable spike in volatility in the early part of this month across a broader set of U.S. stock indices.
| Market Name |
2025 (Yearly close) |
Q1 2026 (close) | June, 2026 Price Range* | Quarter-to-Date % (Q2) | Month-to-Date % (June) | Year-to-Date % (2026) |
|---|---|---|---|---|---|---|
| CBOE Volatility Index (VIX | 14.95 (-13.83%) | 25.25 (+68.90%) | 16.05 - 22.22 | -12.00% | +38.44% | +48.63% |
| S&P 500 Index | 6,845.50 (+16.39%) | 6,528.52 (-4.63%) | 7,599.96 - 7,386.65 | +13.14% | -2.81% | +7.91% |
| Dow Jones Industrial Average | 48,063.29 (+12.97%) | 46,341.51 (-3.58%) | 51,078.88 - 50,872.11 | +9.78% | -0.40% | +5.84% |
| NASDAQ Composite Index | 23,241.99 (+20.36%) | 21,590.63 (-7.11%) | 27,086.81 - 25,169.50 | +16.58% | -7.08% | +8.29% |
| NASDAQ 100 Index | 25,249.85 (+20.17%) | 23,740.19 (-5.98%) | 30,513.86 - 28,508.03 | +20.08% | -6.57% | +12.90% |
| Russell 1000 Index | 3,732.87 (+15.89%) | 3,565.71 (-4.48%) | 4,129.90 - 4,021.93 | +12.79% | -2.61% | +7.74% |
| Russell 2000 Index | 2,481.91 (+11.29%) | 2,496.37 (+0.58%) | 2,905.76 - 2,867.02 | +14.85% | -1.33% | +15.52% |
* based on closing price from June 1, 2026 and June 10, 2026
As you can see in the table above, after a fairly rocky end to Q1, volatility dropped through the first two months of Q2, but the start of June has seen a 38.44% increase in the VIX - pushing it above 20 again.
It's important to remember that U.S. stocks have generally been on a tear to the upside for weeks, so a pullback is not unexpected. Similar to the volatility in Q1, Socrates Platform members could have been studying these markets using our unique set of indicators for signals of a return to volatility heading into this timeframe.
There are a number of factors and "noise" that can influence short-term traders, fundamental analysts and algorithmic trading - such as high inflation, Iran war, etc - but it's probably worth mentioning that this volatility ironically returns right before the upcoming SpaceX initial public offering (IPO), and shortly after the recent news of IPO paperwork being filed by current A.I. darlings OpenAI and Anthropic (although only SpaceX has committed to an IPO date, June 12, 2026).
Remember, the proprietary computer models available in Socrates do not care "what" is driving market behavior at any particular time, it just looks for the data-driven patterns, trends and cycles that could indicate when market behavior may change.
We'll take a slightly deeper dive after the month and quarter closes with some price charts.
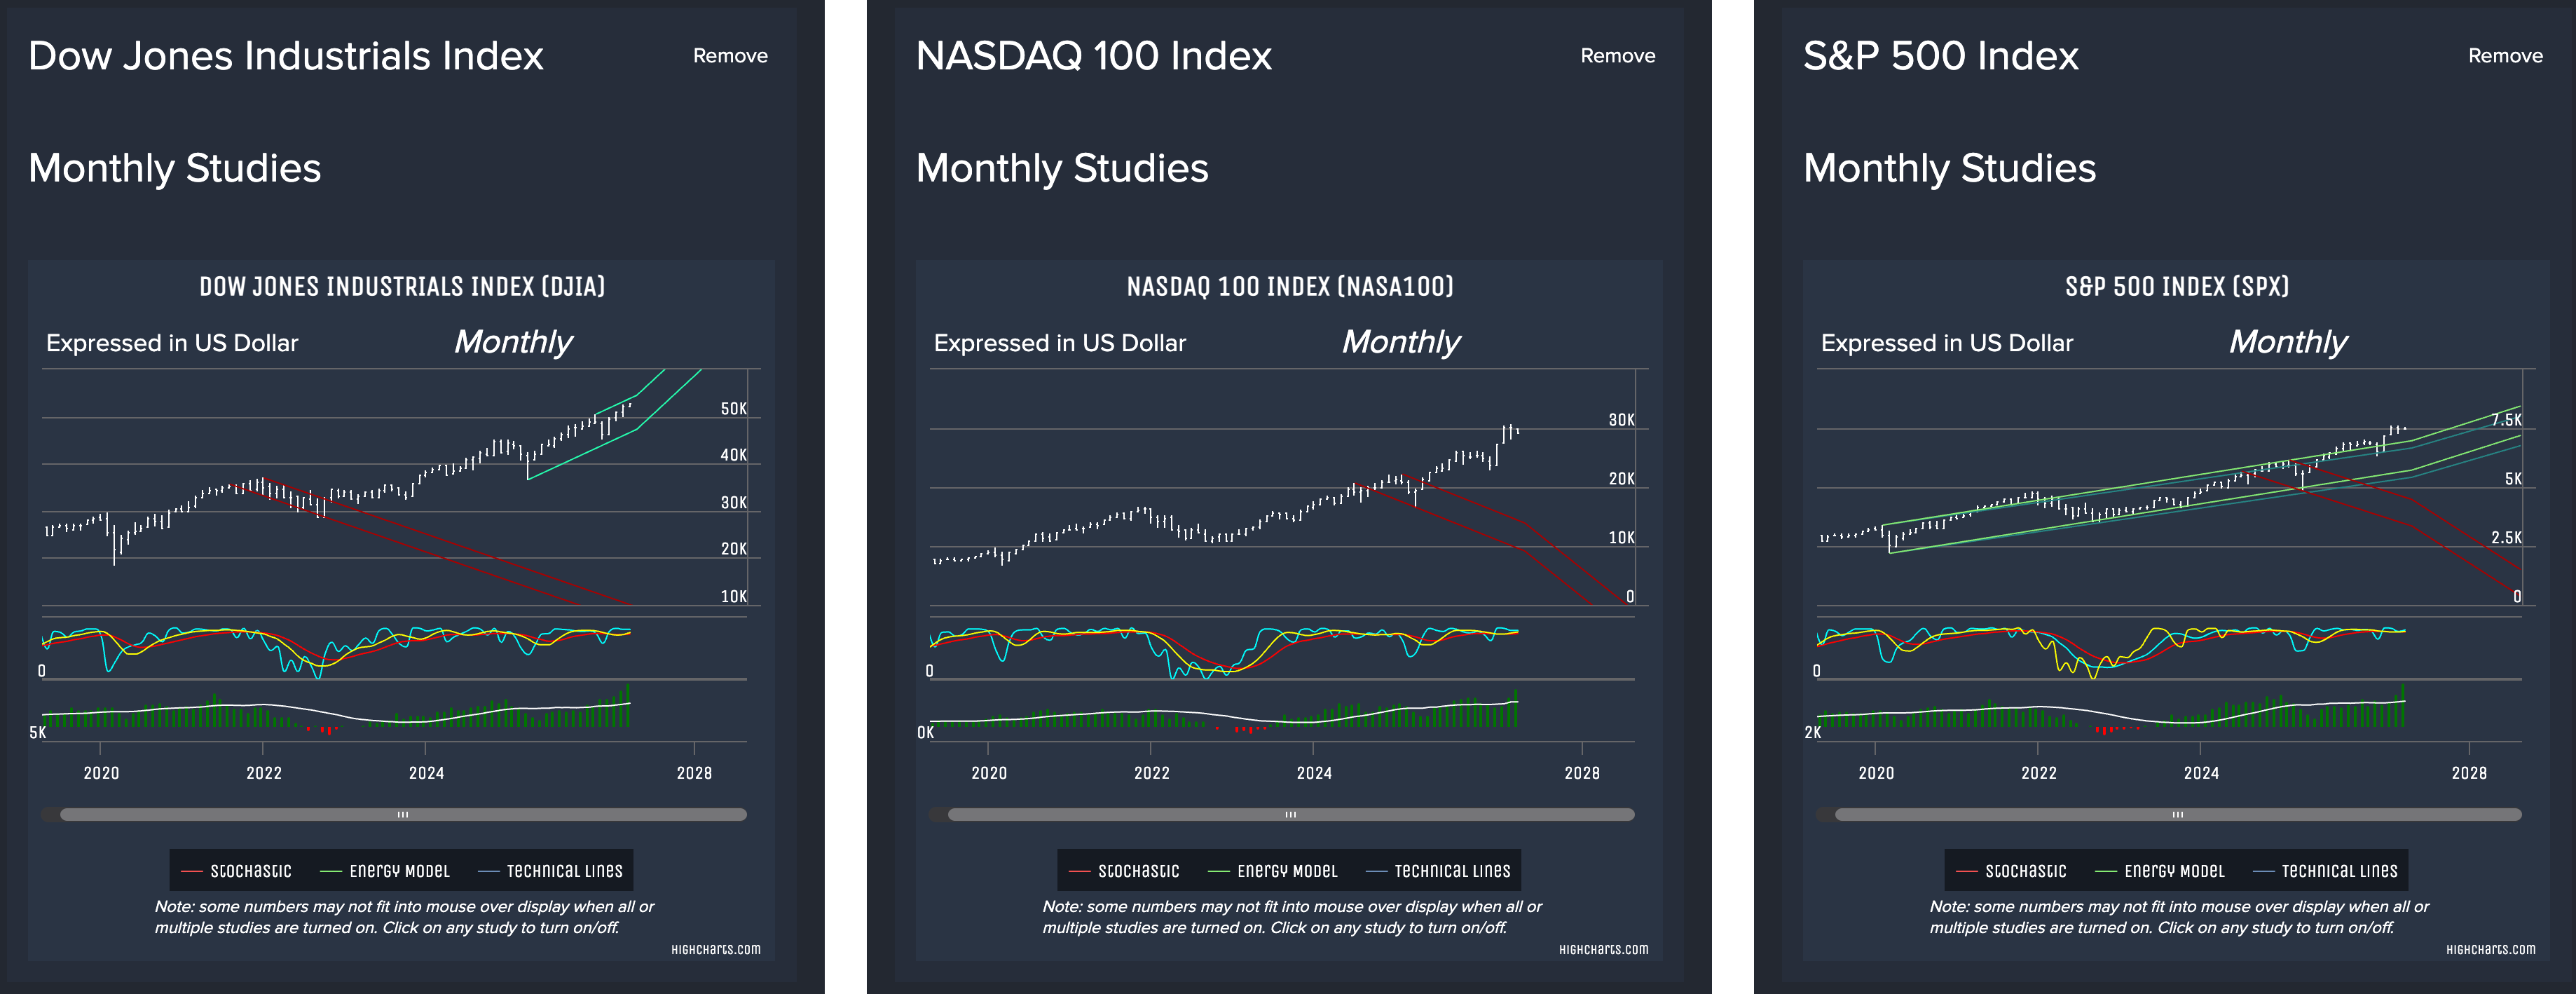
In the meantime, it's good to keep a level head and study performance across multiple time levels (Daily, Weekly, Monthly, etc). Within the Socrates Platform, pay attention to the Global Market Watch pattern recognition, along with the price charts that include the Energy Model (green and red bars at the bottom of the price chart) and our unique Stochastic oscillator (blue, red, yellow lines). For Pro and Enterprise customers, they have the benefit of using our Reversal System and Timing Arrays to their research.
Finally, a quick reminder for those looking to study SpaceX after the IPO - Socrates Platform does not track IPO's. Our proprietary computer models need robust data in order to study behavior and generate our unique indicators, and this can only be collected after enough history and volume of public trading is in place.
In the meantime, Socrates Platform does have a couple of exchange-traded-funds (ETFs) available to research that reportedly count SpaceX in their holdings as of this blog post. These ETFs include:
-> ER Shares Private-Public Crossover ETF (XOVR)
-> ARK Space & Defense Innovation ETF (ARKX)
There are other ETFs expected to include SpaceX in their holdings at some point in the relative near-term (some sooner than others most likely). Below is a list of some possible examples that are available to research on Socrates Platform:
-> Invesco QQQ Trust (QQQ)
-> SPDR S&P 500 ETF Trust (SPY)
-> Vanguard S&P 500 ETF (VOO)
-> iShares Core S&P 500 ETF (IVV)
-> iShares U.S. Aerospace & Defense ETF (ITA)
Keep in mind, inclusion of SpaceX into any of the ETFs above is speculation only right now - there are no confirmed reports regarding when or if any other particular security or financial instrument (stock) will be included in any of the mentioned ETFs mentioned in this posting. These are not recommendations nor are we posting endorsements of any company, stock, ETF, financial instrument, security or financial service.
Remember, no matter how much research you do, or how many different data points, sources or tools you use for your research, trading and investing in financial markets is risky as they can behave unpredictably and lead to significant financial loss. See "IMPORTANT DISCLAIMER" at the bottom of this blog post.
Log in to Socrates to research these and other global financial markets.
Not a Socrates Platform member yet?
With over 1000 global financial instruments to research - including stocks, ETF's, commodities, bonds, foreign exchange / currencies, and more - the Socrates Platform allows members to monitor financial market activity from around the world using price charts, technical studies and custom watchlists.
Click here to compare membership plans, or sign up for Socrates platform today!
IMPORTANT DISCLAIMER: The Socrates Platform is not a financial service and does not provide financial advice. It is a research platform for informational and educational purposes only for a general audience. All information, data, and content available from the Socrates Platform (including but not limited to this blog post) is provided "as-is" without warranty, may contain errors, and does not constitute financial advice. Investments and trades include risk of significant financial loss. Before making any investment or trade decision, you should consider whether it is suitable for you by speaking with a certified financial adviser with fiduciary duty.