Equities battle through a volatile first half to close Q2 in positive territory.
After a relatively strong finish to 2025, this year has seen a fair amount of market movement. Q1 started off relatively strong (including the first close above 50,000 for the Dow Industrial Average), but March introduced some major volatility and negative closes. Q2 started with a bounce followed by another round of volatility in June (albeit less than what was experienced back in March).
This most recent quarter saw the Dow close above 51,000 for the first time, while the S&P 500 crossed two different milestones (closing above 7,500, and then above 7,600), and of course the SpaceX IPO. Throughout it all, the mid-cap Russell 2000 Index has been the most stable of the major U.S. stock indices.
Here's a quick look at the performance across some major global stock indices thus far:
| Stock Index | 2025 Close | Q1, 2026 Close (March) | Q2, 2026 Close (June) | Monthly Change (June) | Quarterly Change (Q2) | YTD (as of July 2, 2026 close) |
| Dow Jones Industrial Average | 48,063.29 | 46,341.511.8 | 52,319.20 | +2.52% | +12.90% | +10.06% |
| S&P 500 Index | 6,845.50 | 6,528.52 | 7,499.36 | -1.06% | +14.87% |
+9.32% |
| NASDAQ Composite Index | 23,241.99 | 21,590.63 |
26,213.72 |
-2.81% | +21.41% |
+11.15% |
| Russell 2000 Index | 2,481.91 | 2,496.37 | 3,024.37 | +3.60% | +21.15% | +20.72% |
| S&P /TSX Composite Index | 31,712.76 | 32,768.04 | 34,856.99 | +0.25% | +6.37% | +11.23% |
| STOXX Europe 600 Index | 592.18 | 583.14 | 641.72 | +2.51% |
+10.05% | +10.23% |
| STOXX Asia / Pacific 600 Index | 219 | 220 | 242 |
-2.02% | +10.00% | +12.79% |
| S&P / ASX 200 Index | 8,714.3 | 8,481.8 | 8,778.69 |
+0.54% | +3.50% | +1.49% |
Uncertainty surrounding the current state of geopolitics and the A.I. boom (including the possible impact on the future of the technology landscape and labor markets) is driving retail investors and fundamental analysts to short-term reactions - which in turn creates more volatility. But, the key for long-term investors is to keep things in perspective. Stay focused on the current trend to see if the short-term behavior aligns with signals of a possible turning point ahead. This is where technical analysis and a long-term, cyclical perspective can help.
Looking at our Global Market Watch pattern recognition system and our cyclical Timing Arrays (for Pro and Enterprise customers only), there are a number of markets showing signals of more volatility ahead this year. It's important to monitor these markets over time to see what signals remain or strengthen vs which may fade with more price action and data to analyze.
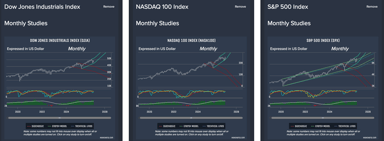
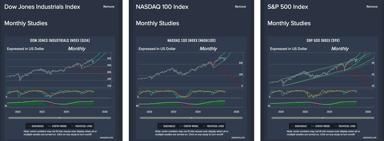
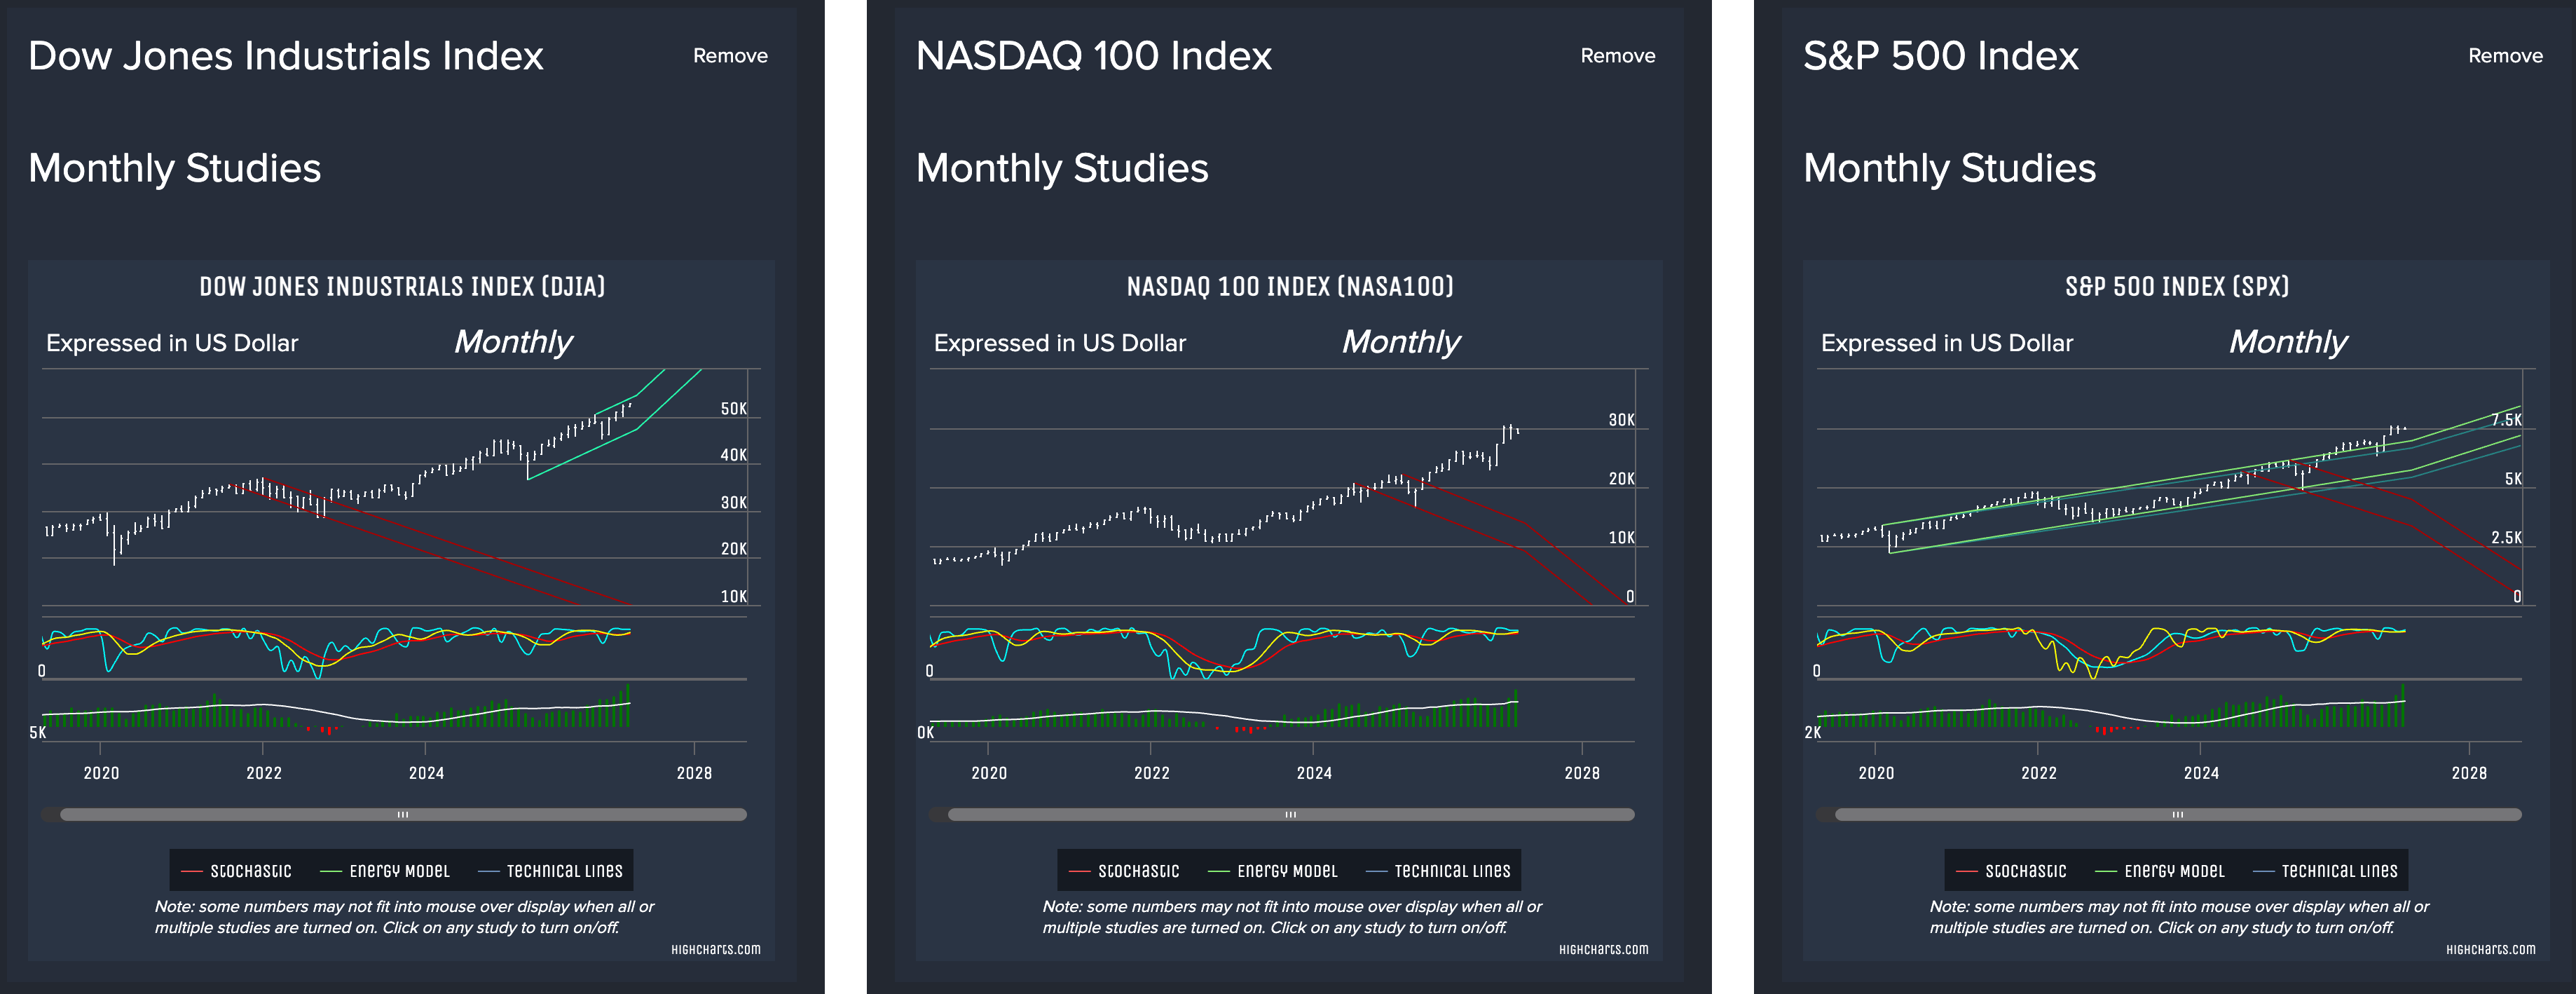
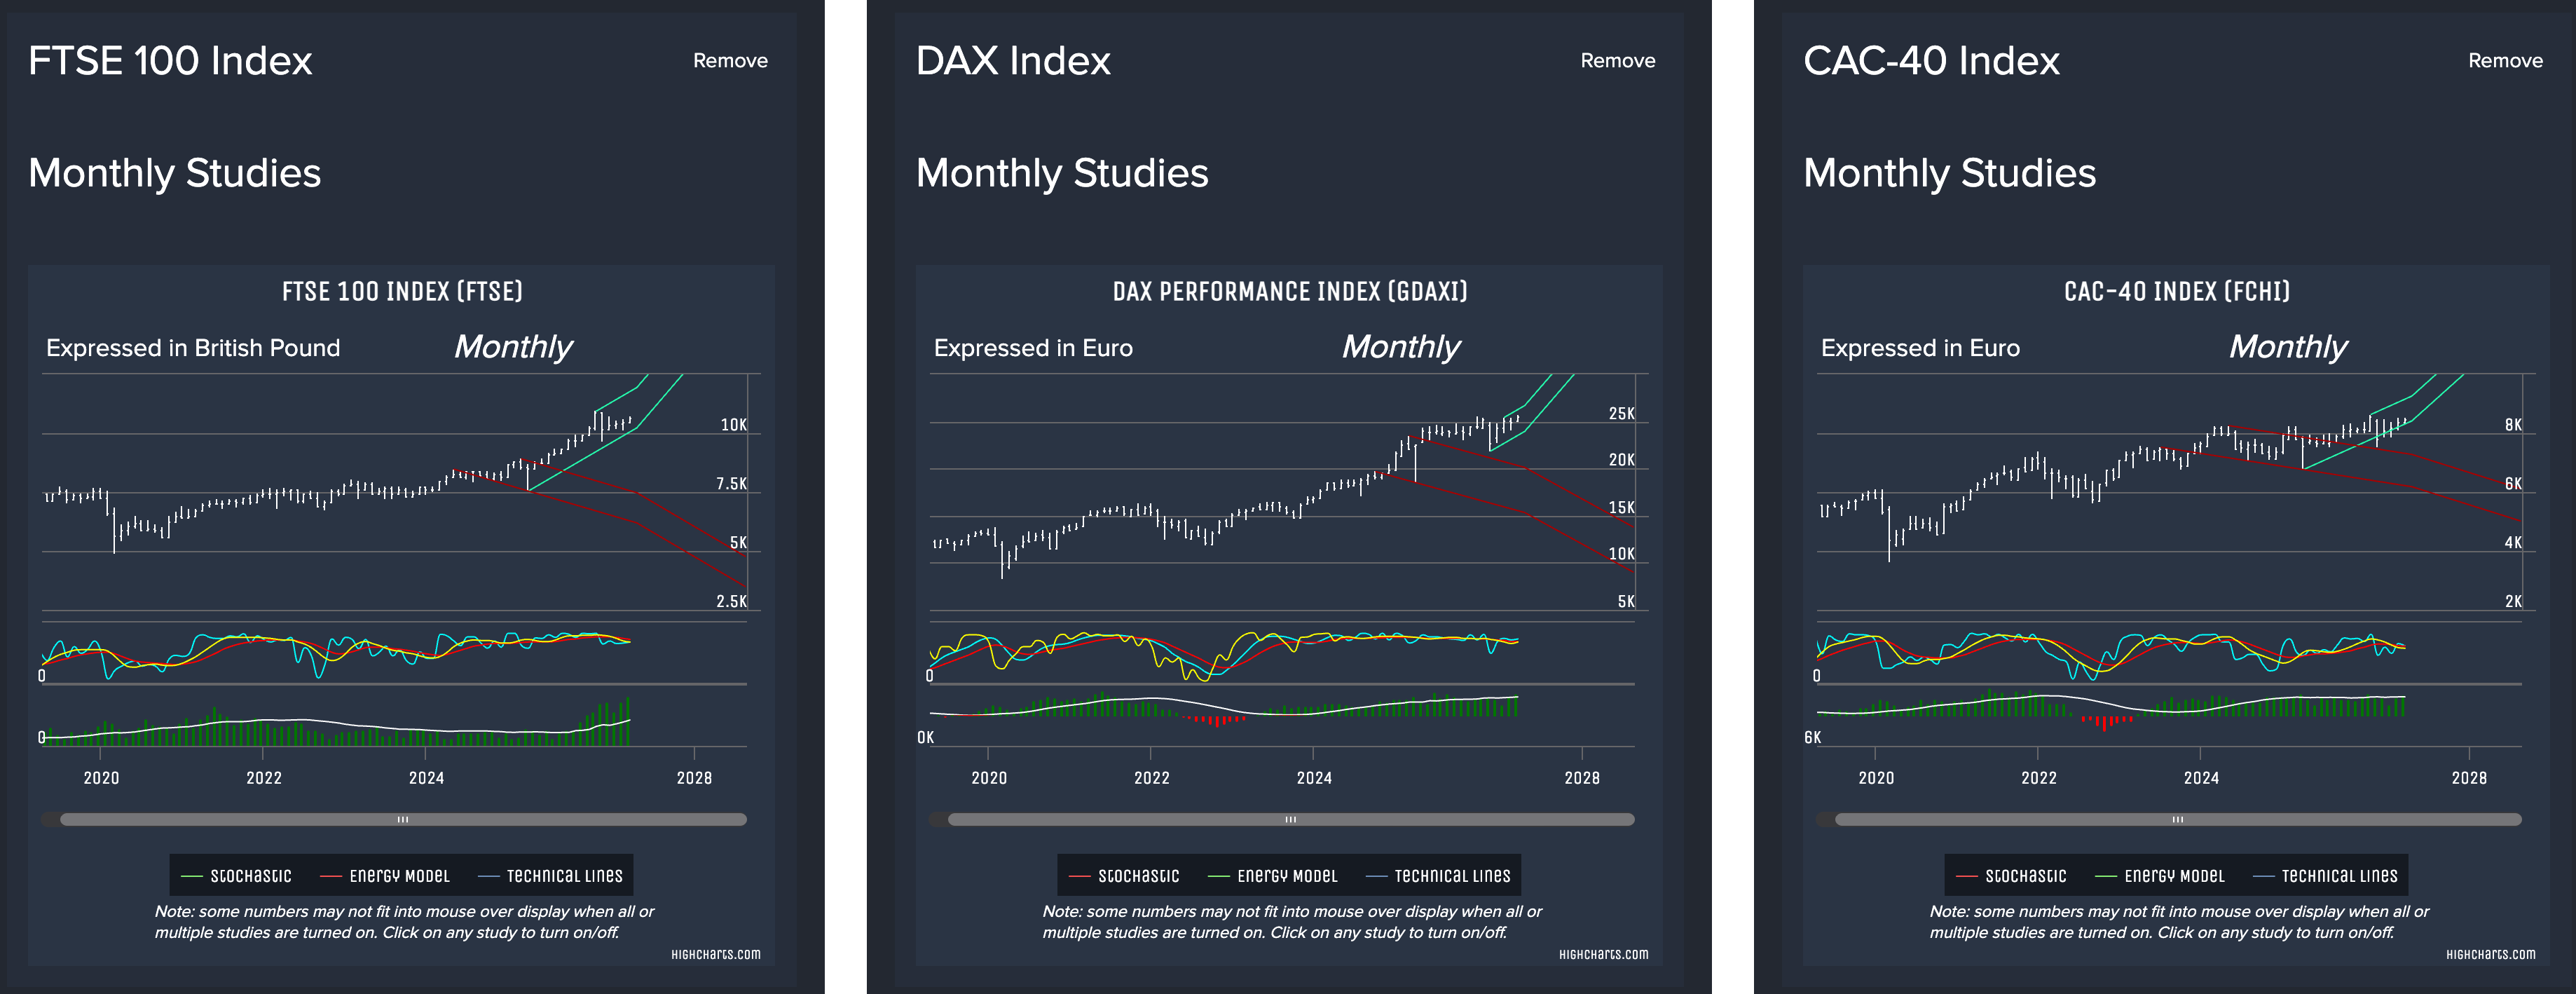
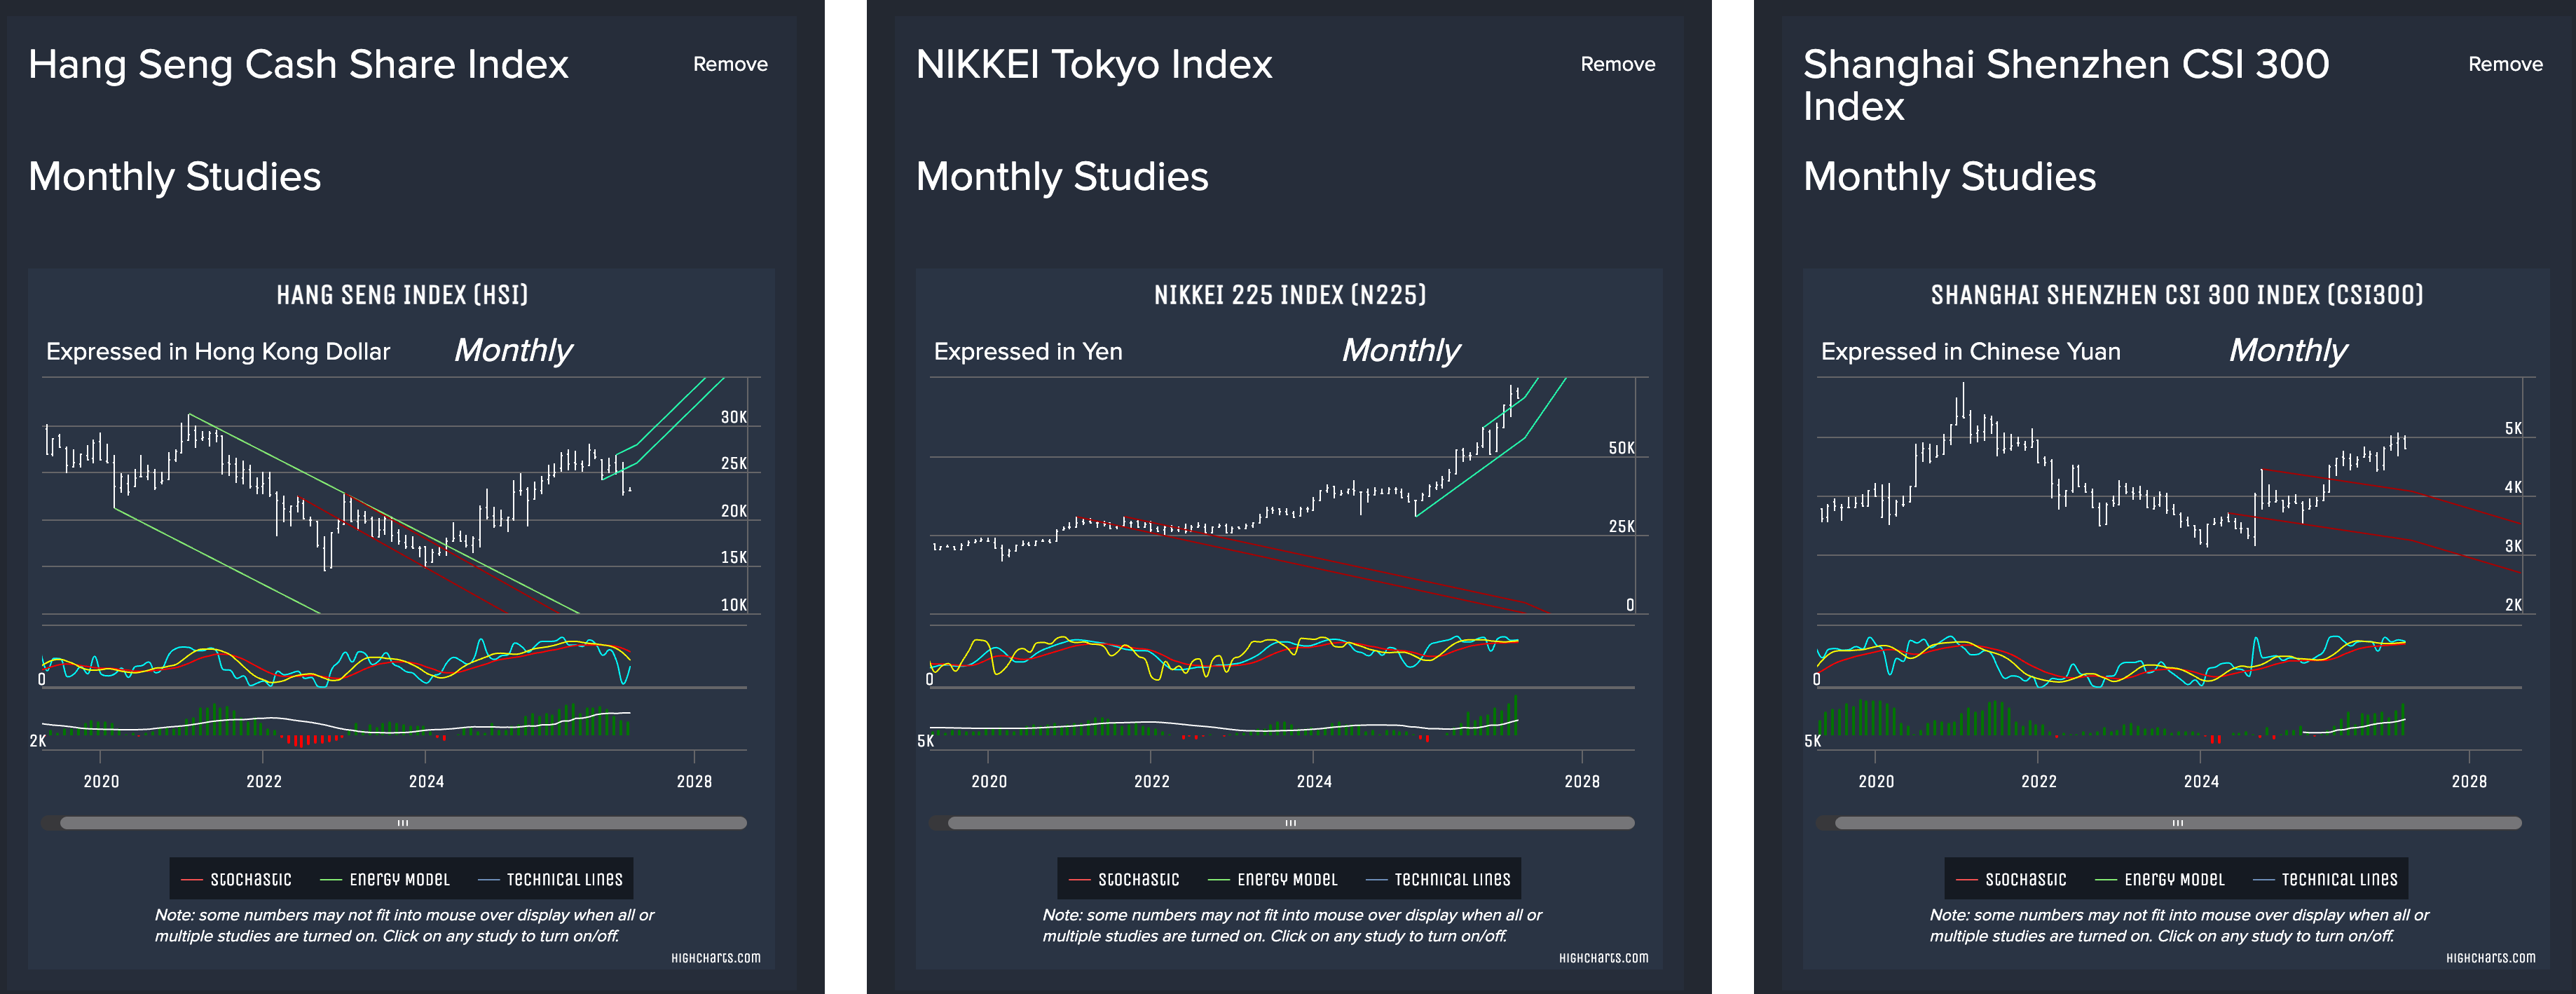
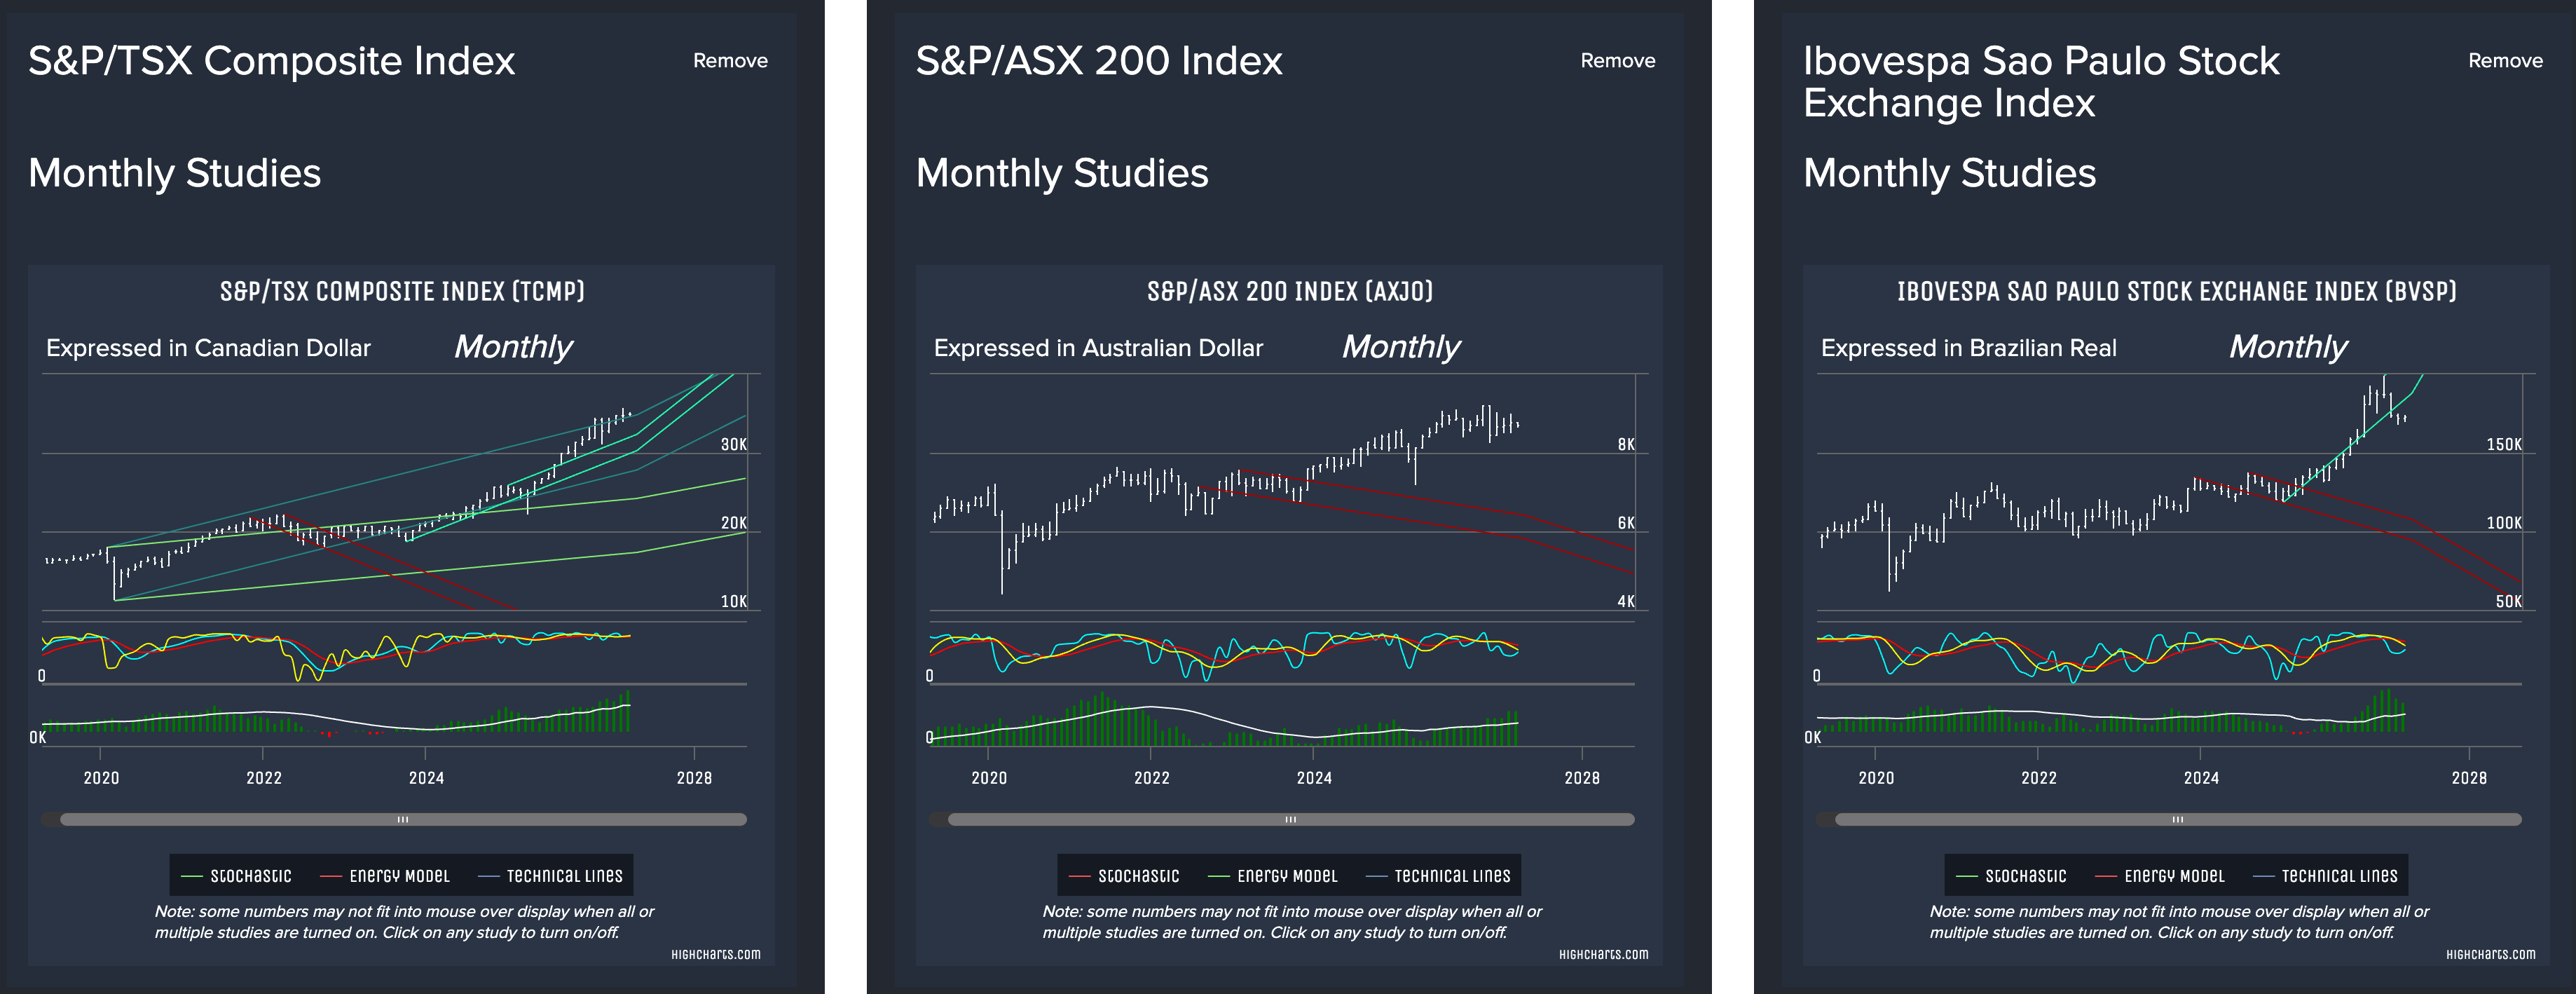
With that said, let's take a look at some price charts. In this post we'll focus on Monthly perspective, but it's good to study performance across multiple time levels (Daily, Weekly, Monthly, etc). Within the Socrates Platform, pay attention to the Energy Model (green and red bars at the bottom of the price chart) as well as the Stochastic oscillator (blue, red, yellow lines) when studying charts. See more below on how to consider these studies - and others - as part of your research.
Keep in mind, the computer-generated trend lines you see on these charts can help identify potential areas of technical support and resistance, but like any other indicator, they can change with more price data - especially new highs and new lows.
United States: Dow Jones Industrial Average, NASDAQ 100 Index, S&P 500 Index
Europe: (UK) FTSE 100 Index, (Germany) DAX Index, (France) CAC-40 Index
Asia: (Hong Kong) Hang Seng Index, (Japan) Nikkei Index, (China) CSI 300 Index
Rest of World: (Canada) TSX Composite Index, (Australia), ASX 200 Index, (Brazil) Ibovespa Index
Notes on Stochastic studies:
- Stochastic values range from 0-100: >80 is commonly interpreted as a market with potentially "overbought" conditions, whereas a value of <20 is considered possibly "oversold" conditions.
- On a price chart, look for Stochastic line crossovers. Generally speaking, a "fast" crossover is typically associated with price direction changes, whereas a "slow" crossover is often considered alignment of momentum and trend.
- The Socrates Platform has a unique three-measurement Stochastic oscillator: Blue (a "fast" measure), Yellow (a "mid" measure), and Red (a "slow" measure). While the "fast" (blue) stochastic is most sensitive to recent price changes, this can also be true for the "mid" (yellow) stochastic.
- In Socrates users can look for when the blue and yellow both cross the red:
- A cross above the red (when <20 value, or "oversold" conditions) can be a signal that a move up may be underway (i.e. red will be the lowest value / position of the three in this scenario)
- A cross below the red (when >80 value, or "overbought" conditions) can be a signal that a move down may be unfolding (i.e. red will be the highest value / position of the three in this scenario)
Notes on the Energy Model:
- A unique study to the Socrates Platform, the Energy Model assesses the relative strength or weakness ("energy") in the current buy-side of a market's price activity vs. the sell-side.
- When analyzing a price chart, look to see when there are consecutive spikes of energy (green bars) well above it's moving average. This may signal an oncoming cresting of energy and a risk of losing momentum ahead.
Remember, using multiple studies and indicators - similar to price activity across different time levels (daily, weekly, monthly, etc) - offers a much better view of short-term vs long-term behavior.
For example, Daily price activity and indicators can be helpful when considering potential entry or exit points for experienced traders as it's most vulnerable to spikes in volatility and reactionary or false moves. In this case, Weekly and Monthly time level analysis can help filter out some of this "noise".
But, if you're primarily a long-term investor, the Monthly time level is likely best when considering entry or exit points, using Daily and Weekly as pulse-read along the way. Bullish markets will "correct" from time-to-time (regardless of why), but that doesn't necessarily mean a change to the long-term trend (which typically requires a sustained move over multiple months breaching key technical levels and triggering key indicators). This is where our Reversal System and Timing Arrays can help.
It's good practice to see if behavior on one time level aligns with other time levels. If you observe consistent activity while studying Daily and Weekly (charts and indicators) week after week, the next logical step would be to look for similar signals on the Monthly time level. If it never fully aligns, this could suggest the price activity is more likely short-term in nature and not a change to the long-term trend (which would eventually reveal itself on the Monthly and Quarterly time levels).
Important: no matter how much research you do, financial markets are risky and can behave unpredictably - especially on a short-term basis.
Log in to Socrates to research these and other global financial markets.
Not a Socrates Platform member yet?
With over 1,400 global financial instruments to research - including stocks, ETF's, commodities, bonds, foreign exchange / currencies, and more - the Socrates Platform allows members to monitor financial market activity from around the world using price charts, technical studies, proprietary computer models and custom watchlists.
In addition to the price charts mentioned above with Stochastic studies and our Energy Model, all Socrates users have access to other computer-generated indicators, such as our proprietary Global Market Watch pattern recognition system and our Indicating Ranges. These color-coded signals act as a complement to more detailed studies.
Pro and Enterprise members can use our advanced fullscreen charting to draw their own trend lines, apply more technical studies, and go deeper in their research with our Reversal System and Timing Arrays to look for additional areas of technical support, technical resistance, and possible turning points ahead.
Click here to compare membership plans, or sign up for Socrates platform today!
NOTE: The Socrates Platform is not a financial service and does not provide financial advice. It is a research platform for informational and educational purposes only. Investments and trades include risk of financial loss. Before making any investment or trade, it is important to consider whether it is suitable for you. Consider seeking advice from a certified financial adviser.