The Dow, S&P and NASDAQ all had big gains in 2024!
Even with a shaky, volatile December, US Equities closed out another strong year in 2024. The Dow Jones Industrials Index closed December down for both the month vs November (-5.27%) but finished up on a quarterly basis (+0.51%) vs Q3 2023, and on a yearly basis (+12.88%) vs 2023 year-end.
Similarly, the S&P 500 closed the month of December down (-2.50%), but finished the quarter up (+2.07%) and up for the year (+23.31%). It's worth calling out that the S&P 500 has increasingly become a top-heavy index. By comparison, the S&P 500 equal weight closed December down for the month (-6.44%), down for the quarter (-2.32%), but still up for the year (+10.90%), albeit much less so than the flagship cap-weighted version of the index.
Now, looking at the NASDAQ indices things faired a bit better. The NASDAQ Composite closed December up on a monthly basis (+0.48%), a quarterly basis (+6.17%), and a yearly basis (+28.64%). From a more narrow POV, the popular NASDAQ 100 index was also all green, closing December up for the month (+0.39%), up for the quarter (+4.74%) and up for the year (+24.88%). Both major US NASDAQ indices were the winner of December and 2024.
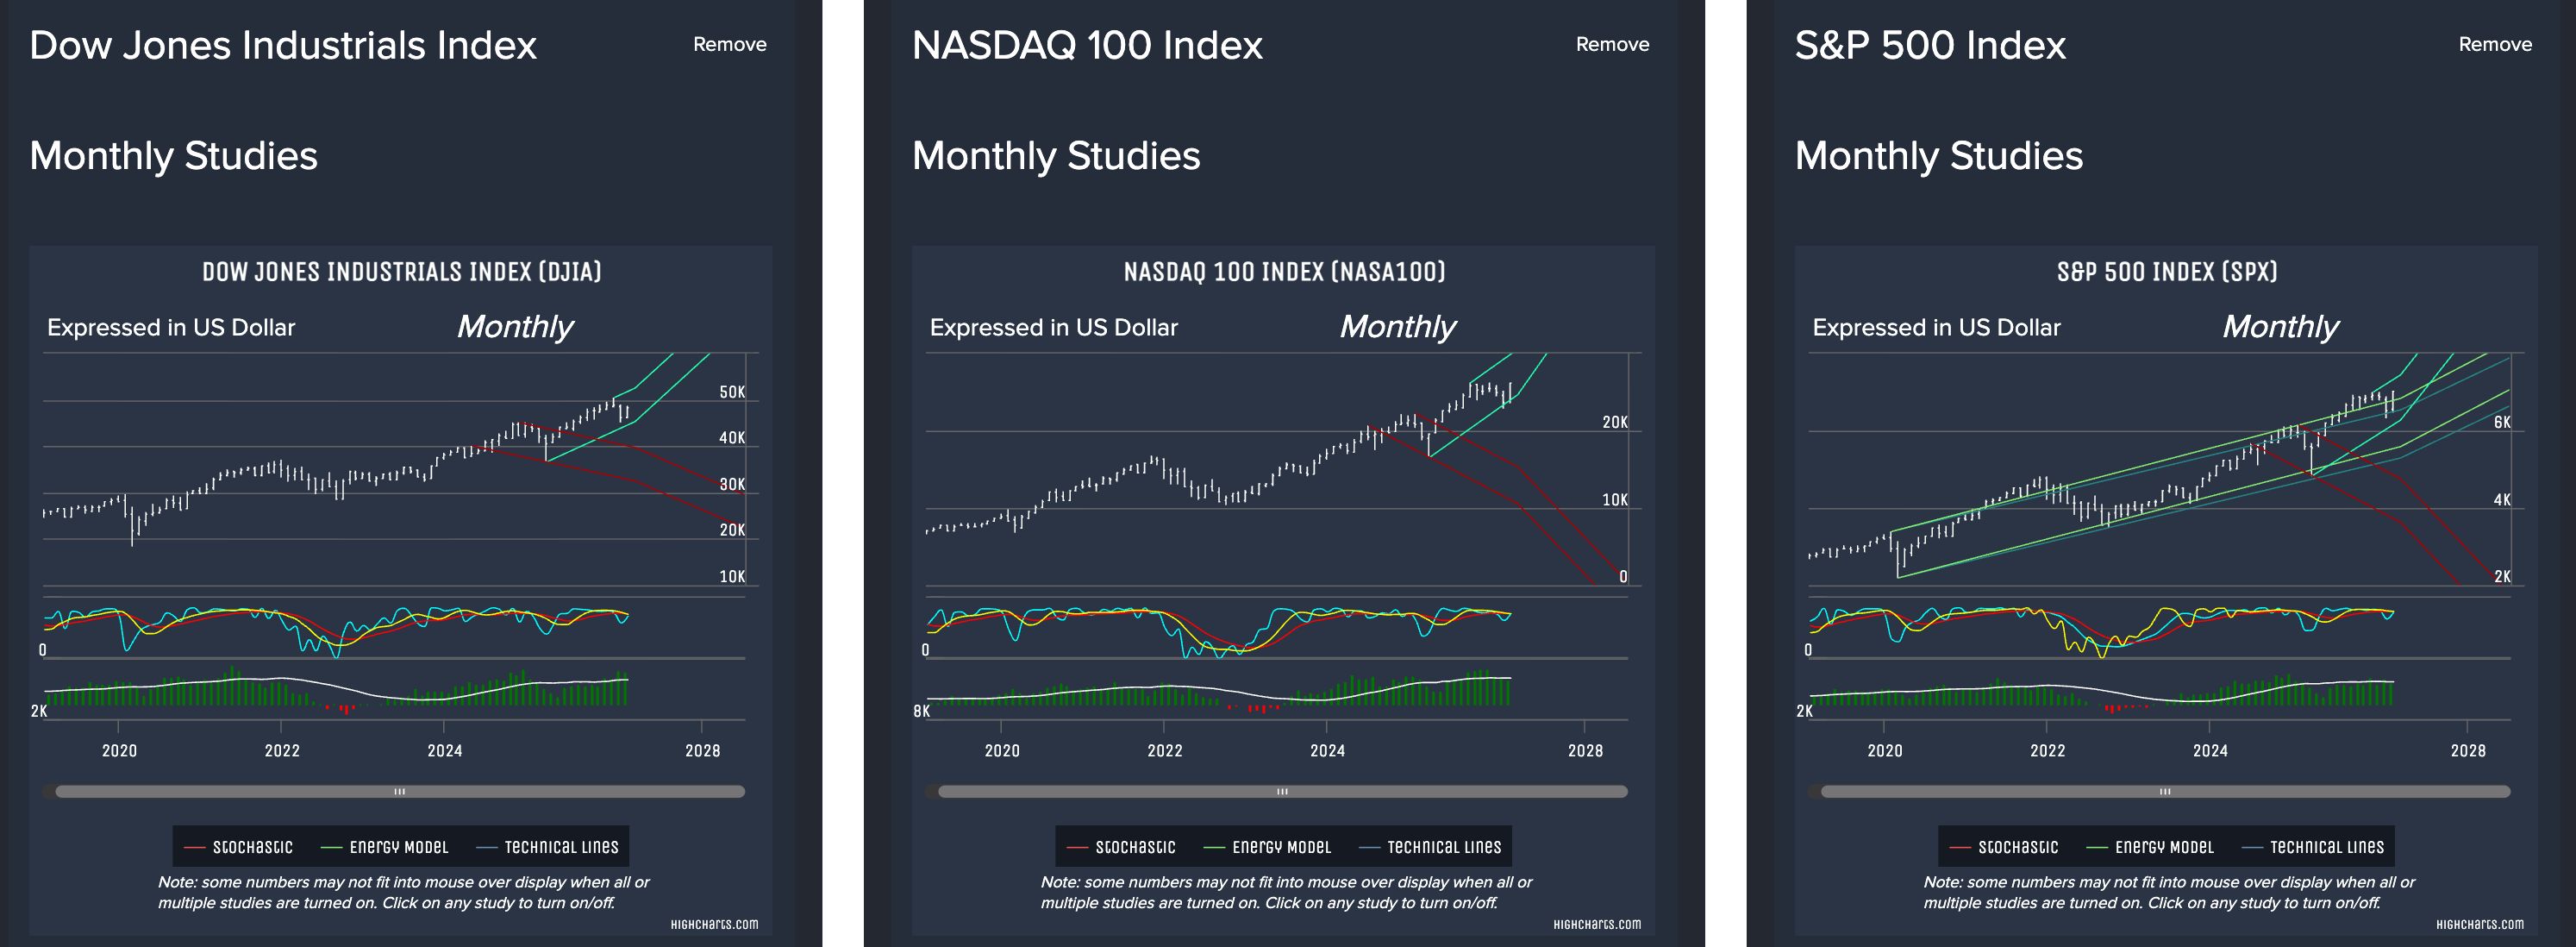
Let's take a look at some monthly price charts to visualize the big picture performance. You can see an consistent move up since late 2022 across most of the various US stock indices (with a few periods of some choppiness). Looking at the oscillators, you can see the unique Socrates yellow stochastic line with notable crosses of the red (slow) and blue (fast) stochastic lines, coupled with with a bounce in most cases of the Energy Model before leveling out.


When studying price charts in the Socrates Platform, pay close attention to the trend lines and oscillators - the Stochastic and Energy Model in particular. When the Energy Model spikes well above its moving average, it indicates a higher risk of losing momentum, which could mean a change in direction may be ahead. In addition, the Socrates Platform includes a unique third stochastic line (yellow) and when it crosses both red (slow) and blue (fast) stochastic lines it can be a helpful indicator, especially if you see alignment with a notable change in the Energy Model.
More generally, the most common approach to studying stochastic indicators is to follow the numerical values: when >80 a market is considered in possible "overbought" condition; when <20 a market is considered in possible "oversold" conditions. Many also look for line crossovers to signal potential alignment of momentum and trend (red crossovers), along with price direction changes (blue crossovers). Keep in mind, the blue (fast) stochastic line is more sensitive to recent price changes, and this can be amplified if you are looking at daily price movement (vs Weekly or Monthly price movement).
Researching markets across different time levels offers a much better view of short-term vs long-term activity. Many follow financial markets on a daily basis, which can certainly be helpful - especially at times of potential market entry or exit - but it's important to keep in mind daily price movement (and indicators based on daily price movement) is most vulnerable to spikes in volatility with reactionary or false price moves. The monthly (and quarterly) time level tends to even out the noise a bit by contrast, providing a cleaner view of actual market trends over the long-term.
Regardless of time level, a change in direction can just be a (relatively) short-term move or brief market correction, it does not necessarily mean it is a true change in the longer term trend. This is why studying market behavior consistently over a period of time, and across multiple time levels (daily, weekly, monthly, etc) is helpful.
Also, while intra-day price movement is worth studying, the Socrates Platform proprietary computer models more heavily weight closing price for each time level as it's a stronger signal of sentiment for that trading period (that day, that week, etc).
Log in to research these and other global financial markets. Go beyond the charts with the Global Market Watch pattern recognition (monthly, quarterly and yearly in particular) along with the Indicating Ranges on a weekly and monthly closing basis. See how - or if - price movement aligns with what different technical indicators and models are picking up on across various time levels (weekly, monthly, etc). This can help shed light on what might be ahead on both a short and long term basis.
Pro and Enterprise members can go deeper in their research with the Reversal System and Timing Arrays, as they look for potential turning points ahead. Keep an eye out for clusters of Reversal points as they represent areas of technical support (Bearish Reversals) and technical resistance (Bullish Reversals). Take note of any relatively large gaps in where Reversal points exist, as it may highlight where a market could see notable price movement before reaching support or resistance.
Not a Socrates Platform member yet?
With over 1000 global financial instruments to research, from stocks, commodities, bonds, and more, the Socrates Platform allows members to monitor financial market activity from around the world using price charts, technical studies, custom watchlists, unique indicators, and proprietary computer models (the Reversals, Timing Arrays, Global Market Watch, Indicating Ranges, and the Energy Model).
Click here to compare membership plans, or sign up for Socrates platform today!